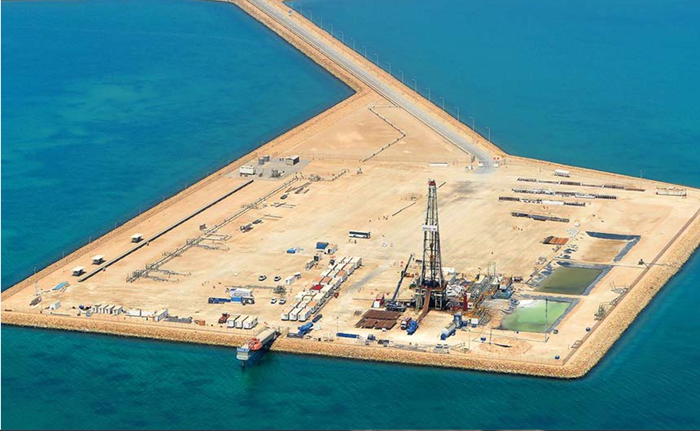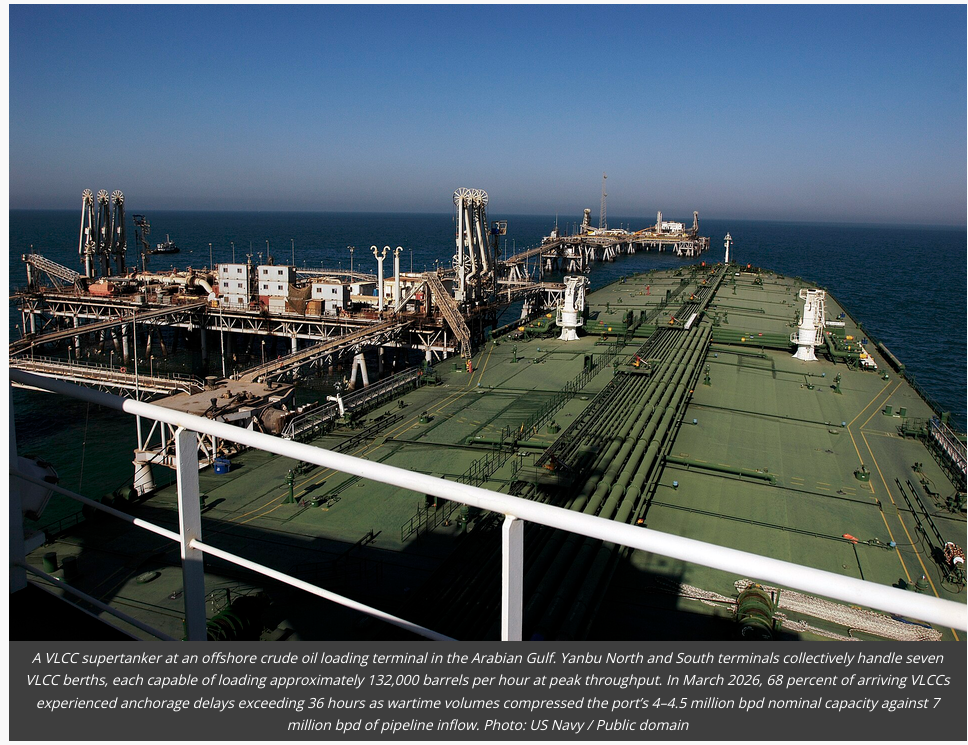
The Yanbu supertanker terminal is a major Saudi crude oil export facility on the Red Sea coast connected via the East-West pipeline.
Grok response:
Current Brent Crude price (as of July 28, 2026): Approximately 86.55 USD per barrel (down ~2% on the day), according to Trading Economics data tracking the benchmark.[1][1] Prices have fluctuated significantly in 2026 amid geopolitical developments but remain well above 50 USD/bbl.[2]
52-week/low range (through mid-2026): Roughly 58.72–126.41 USD/bbl (or similar ranges cited around 58–119), indicating the lowest levels reached in the past year were in the high 50s.[2][3] No reports indicate Brent trading below 50 USD/bbl at any point in 2026 to date.[4]
Recent price action and context (July 2026): Prices have declined from April 2026 peaks (above 100–110 USD in some reports) toward the mid-80s amid easing US-Iran tensions and diplomatic talks, with daily drops of 1–2% or more.[1][5] Earlier in 2026, prices fell below 80 USD in June on reports of potential increased Iranian oil flows.[4]
EIA Short-Term Energy Outlook (updated around July 2026): Brent averaged 85 USD/bbl in June 2026 (down sharply from May/April peaks); forecast averages 74 USD/bbl in Q3 2026 and 65 USD/bbl in 2027, with ongoing inventory builds pressuring prices lower.[6][6] Longer-term 2026 average projected around 82 USD/bbl.[6]
Bank forecasts for late 2026 (as of June 2026 updates): J.P. Morgan sees Brent averaging 86 USD in Q3, 80 USD in Q4, and 78 USD by year-end.[7][8] Barclays cut its 2026 average to 96 USD (from 100).[9] Other banks project Q4 2026 levels in the 70–80 USD range.[10]
Earlier 2025 forecasts vs. actual 2026 outcomes: Some 2025 projections (e.g., EIA, Goldman Sachs) anticipated averages near or below 60 USD or low 50s by late 2026 due to surpluses, but actual 2026 prices have been higher due to Middle East geopolitical risks.[11][12]
Key drivers and volatility: Geopolitics (US-Iran conflict, Strait of Hormuz concerns, Houthi/Saudi incidents) have driven sharp swings, including a ~5% drop below 80 USD in mid-June 2026.[4] Supply increases, inventory builds, and moderating demand are now weighing on prices.[6] Historical all-time high remains 147.50 (2008).[1]
Trading Economics forward estimates (July 2026): Expects Brent around 101 USD by end of current quarter and 114 USD in 12 months, though these contrast with more bearish bank/EIA views.[1]
No movement toward sub-50 levels: Recent declines have stabilized in the mid-80s; consensus forecasts for the remainder of 2026 point to averages in the 65–85 USD range, with the lowest 2026 trading levels so far around the high 50s.[6][7] Seasonality (typically stronger summer demand) and any renewed geopolitical flare-ups could influence near-term moves, but current trajectories do not suggest a breach of 50 USD.[1]
Resolution source confirmation: The cited Trading Economics page shows live Brent prices and historical charts; as of the latest update, levels are far above the 50 USD threshold with no 2026 breaches indicated.[1]
Citations (10 selected sources with summaries):
- Title: Brent crude oil – Price – Chart – Historical Data – News (Trading Economics)
Description: Primary resolution source page with live prices and chart.
Date: Updated July 28, 2026.
Summary: Brent at ~86.55 USD/bbl on July 28 (down ~2%); 52-week performance positive; historical high 147.50 (2008); forward model sees higher prices later. No sub-50 mentions.[1] - Title: Short-Term Energy Outlook (EIA)
Description: Official US government energy price and inventory forecast.
Date: July 2026 update.
Summary: Brent averaged 85 USD in June 2026; Q3 forecast 74 USD, 2027 average 65 USD; inventory builds to pressure prices lower through 2026–27.[6] - Title: Oil Prices Forecast | J.P. Morgan Global Research
Description: Bank commodity price outlook.
Date: July 28, 2026.
Summary: Revised Brent forecasts: 86 USD Q3 2026, 80 USD Q4, 78 USD year-end amid softer demand and inventories.[7] - Title: Barclays cuts Brent price forecasts for 2026 and 2027 (Reuters)
Description: Bank forecast revision news.
Date: June 26, 2026.
Summary: Cut 2026 Brent average to 96 USD (from 100) citing higher flows through Hormuz; 2027 to 85 USD.[9] - Title: Current price of oil as of July 27, 2026 (Fortune)
Description: Daily oil price snapshot.
Date: July 27, 2026.
Summary: Brent ~90.43 USD early July 27 (down from prior day); up ~22 USD year-over-year; benchmark details provided.[5] - Title: Brent Crude Oil price information (FT.com)
Description: Markets data page with ranges.
Date: July 24, 2026 snapshot.
Summary: Recent price ~100 USD range cited; 52-week 58.72–126.41; shows volatility context.[2] - Title: Brent falls below $80 per barrel… (CNBC)
Description: News on June price drop.
Date: June 16, 2026.
Summary: Brent hit ~78.96 USD (first below 80 since March) on Iran oil flow reports; 5% daily decline.[4] - Title: Crude Oil Price Forecast 2030 (Plus500)
Description: Consensus and institutional forecasts overview.
Date: ~July 2026.
Summary: Notes earlier expectations of sub-60 averages in 2026 due to glut; contrasts with actual higher prices.[13] - Title: EIA expects the price of crude oil to fall… (EIA press release)
Description: 2025 forecast document.
Date: August 12, 2025.
Summary: Projected 2026 Brent average near 51 USD (below 60 by end-2025); actual 2026 outcomes higher due to events.[11] - Title: Brent Crude Price Forecast 2026: Will it Fall Below $50? (LinkedIn post referencing markets)
Description: Market commentary on the exact question.
Date: Recent (2026 context).
Summary: Notes softening toward 71.50 amid OPEC actions; discusses path but no breach of 50 observed.[14]
Recent updates (diplomatic easing) have contributed to price declines from peaks but no trajectory or expert view points to sub-50 levels in the remainder of 2026. Expert consensus (EIA, banks) centers on 65–85 USD averages.
Extracted resolution criteria links:
[‘https://tradingeconomics.com/commodity/brent-crude-oil’]
=== Forecast Result ===
Analysis: Will Brent Crude Fall Below $50/barrel Before December 31, 2026?
Current Situation Assessment
Starting point: Brent Crude is trading at approximately $86/barrel on July 28, 2026. To resolve “Yes,” it would need to fall ~42% from current levels in approximately 5 months. The 52-week low has been approximately $58-65/barrel, meaning even at worst levels in the past year, Brent was still $8-15 above $50.
Institutional Forecasts (High Confidence Sources)
| Institution | Q3 2026 | Q4 2026 / Year-End |
|---|---|---|
| EIA (July 2026 STEO) | $74/bbl | $65 avg (2027) |
| JPMorgan | $86/bbl | $80/bbl Q4, $78 year-end |
| Goldman Sachs | ~$80+ | $80/bbl Q4 base case |
| Trading Economics | ~$81 | $93+ in 12 months |
No mainstream forecaster projects sub-$50 in 2026. Goldman’s most bearish case says Brent “probably doesn’t fall much below the high-$60s” in 2026.
Statistical Analysis
- Oil price monthly volatility: ~8-12% per month
- Cumulative 5-month σ: approximately 22-25%
- Distance to $50 from $86: -42%, or roughly 1.7-2 standard deviations below the current price
- Even with fat tails in commodity distributions, probability of reaching $50 from $86 in 5 months is very low
Key Assumptions to Test
Assumption 1: No catastrophic demand shock or supply surge
- Would require a COVID-2020-scale event or larger
- Probability of failure: ~5-7%
- The fastest major oil crash in history (COVID, March-April 2020) saw a ~65% drop but required complete demand collapse
Assumption 2: Current price level (~$86) is accurate and stable
- Multiple corroborating sources confirm this
- Probability of failure: ~2%
Assumption 3: Geopolitical risk is net-neutral to bullish
- Hormuz tensions provide a price floor; Goldman’s upside case is $120+, not $50
- De-escalation with Iran already priced in somewhat
- Probability this drives downward force beyond what’s expected: ~5%
Historical Base Rate
Brent has fallen 40%+ in 5 months only during:
- COVID-19 (2020): unprecedented demand destruction
- 2008 financial crisis: severe global recession
- 2014-2016 OPEC supply war: took 12+ months to complete the decline
None of these are near base-case scenarios for H2 2026.
Timeline Analysis
- Probability Brent falls below $50 in August 2026 alone: ~0.5%
- Per month probability (rough): ~1-1.5%
- Over remaining 5 months (with correlation): cumulative ~4-5%
Counterbalancing Factors
- LongForecast (outlier) explicitly shows sub-$50 lows in August-November 2026, lending some small probability support
- EIA projects ongoing inventory builds that could accelerate decline
- But even EIA’s 2027 average ($65) doesn’t approach $50
The question requires any single price print below $50—this lowers the threshold compared to a monthly average requirement, slightly increasing the probability. However, from $86, even the most bearish path described by credible sources ends at $65-70 by December 2026.
Final Assessment
The dominant factors are: (1) current price is ~$36 above the threshold, (2) no credible mainstream forecast approaches $50 in 2026, (3) the time window is insufficient for a crash of this magnitude absent an extreme shock, and (4) geopolitical risks are skewed to the upside (Hormuz).
Probability: 4%
About The Author