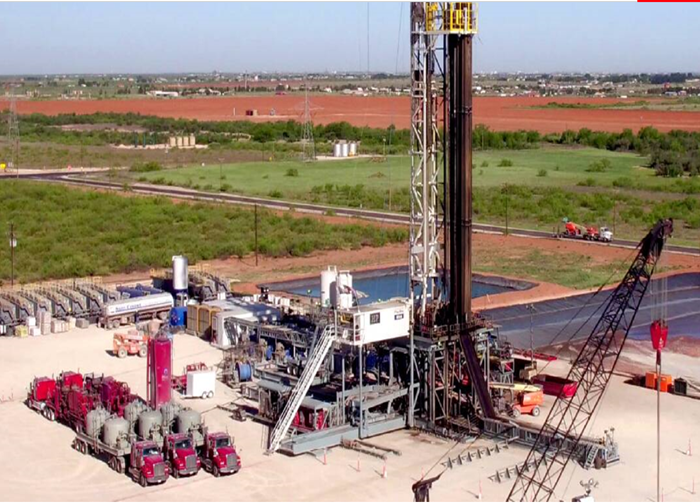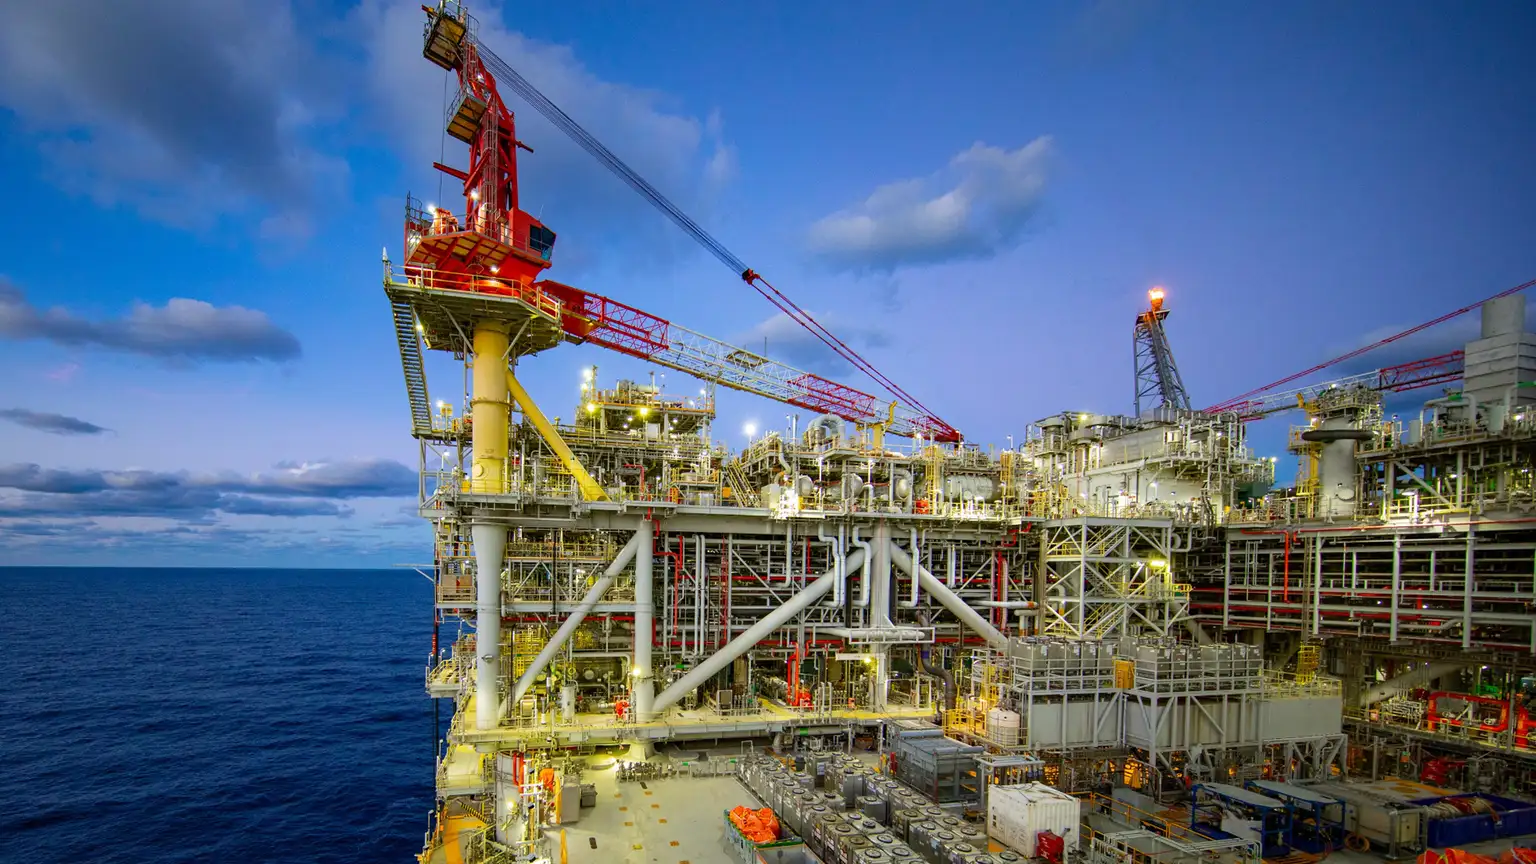
The Argos Platform is a giant semi-submersible deepwater facility operated by BP in the Gulf of Mexico. Argos has gross production capacity of up to 140,000 barrels of oil per day. Source: https://www.bp.com/en_us/united-states/home/news/press-releases/bp-starts-oil-production-at-argos-platform-in-the-gulf-of-mexico.html
Grok response:
10 Key Citations
- Brent crude oil – Price – Chart – Historical Data – News (Trading Economics)
Authoritative resolution source for the question, providing live CFD-tracked Brent prices, stats, and model-based forecasts. Published/updated August 25, 2026. Brent traded at 89.297 USD/bbl (down 3.12% on the day), up 33.8% year-over-year; Q3-end forecast 96.11, 12-month outlook 111.28. Recent news notes a 3% drop amid possible Iran-US diplomatic progress easing supply fears. Historical all-time high 147.50 (2008); data through 2026.[1] - Short-Term Energy Outlook (U.S. EIA, August 2026)
Official U.S. government short-term energy forecast with global oil market assumptions, prices, and inventories. Released August 11, 2026 (forecast completed August 6). Projects Brent average $87/bbl for 2026 overall ($85 in 3Q26, falling to $78 in 4Q26) then $69 in 2027, citing ongoing Hormuz disruptions keeping inventories tight near-term before recovery. U.S. crude production seen at 13.8 million b/d in 2026. Assumes most Middle East production restarts in early 2027.[2] - Short-Term Energy Outlook: Global oil markets (EIA)
Detailed EIA analysis of global petroleum balances, inventories, and prices. August 2026 update. Estimates 4.2 million b/d inventory draws in 2Q26 and 3.8 million b/d more in 3Q26 due to Hormuz constraints, supporting $85/bbl Brent in 3Q26 before easing to $78/bbl in 4Q26 as flows recover. 2026 Brent average $87 vs. $69 in 2025; global liquids production 106.1 million b/d projected for 2026. Notes U.S. inventories below five-year lows.[3] - Oil Prices Forecast | J.P. Morgan Global Research
Bank research update on commodity outlooks including quarterly Brent averages. Recent 2026 update. Forecasts Brent averaging $86/bbl in 3Q26, $80 in 4Q26, and $78 at year-end. Lower than some prior views but still elevated vs. pre-crisis levels due to supply disruptions. Highlights geopolitical risks around Iran and Hormuz.[4] - Oil Market Report – August 2026 (IEA)
International Energy Agency monthly analysis of global oil supply, demand, and balances. Published August 12, 2026. World oil demand forecast to decline 1.6 million b/d in 2026 (deeper than prior month) due to Hormuz closure, high prices, and weaker consumption; supply down 4.3 million b/d to 102 million b/d. Demand contraction eases from 4.9 million b/d in 2Q26 to 2.8 million b/d in 3Q26 before 4Q growth. Assumes gradual Hormuz recovery but notes renewed hostilities as a risk.[5] - Price of oil (Wikipedia)
Encyclopedic overview of historical and recent oil price movements with geopolitical context. Updated with 2026 events. Documents March 2026 surge above $100/bbl (intraday high $119.50 on March 9) driven by Iran war outbreak, strikes on infrastructure, and Strait of Hormuz closure—the first such threshold since 2022. Prices later moderated around $100 after G7 SPR discussions; Iranian officials warned of $200 potential. Contextualizes 2026 as a high-volatility war year.[6] - Oil settles up more than 2% after Trump threatens countries supporting Iran (Reuters)
News report on daily oil price action and U.S. policy. Published August 20, 2026. Brent settled up 2.4% at $93.78 (highest since late July) after President Trump warned of economic retaliation against Iran supporters. Fifth straight session of gains amid war that has stranded Middle East barrels. Highlights ongoing Hormuz impacts and investor focus on de-escalation vs. further disruption.[7] - Citi Raises Brent Forecast for 2026; Sees $150 Oil if Hormuz Disruption Persists (EnergyNow)
Bank forecast revision amid geopolitical risks. Published April 2026. Citi lifted 2026 Brent outlook, with base case $110/95/80 for 2Q/3Q/4Q (50% probability); $150 spike and $130 averages in 2Q-3Q if Hormuz remains closed through June, easing to $100 in 4Q. Reflects supply shock from Iran conflict. Contrasts with earlier pre-war bearish views.[8] - Brent Crude Oil Prices (1987-2026) / History (Macrotrends)
Long-term historical daily/monthly price charts and averages. Data through August 2026. Shows 2026 monthly closes around $95 in August; earlier 2026 points include ~$71-72 in January-February. 52-week context aligns with lows near $58-61 in late 2025/early 2026 before the March spike. Annual average data and inflation-adjusted views available; range illustrates high 2026 volatility.[9] - Current price of oil as of August 17, 2026 (Fortune)
Snapshot of contemporaneous pricing with year-ago comparison. Published August 17, 2026. Brent at $91.53/bbl (up 86 cents from prior day, +$25.65 or ~39% vs. year-ago). Table shows recent daily/monthly/yearly changes. Useful for tracking intra-month moves amid Iran-related news. Complementary to live sources like Trading Economics.[10]
Detailed Rundown of Relevant News, Data, and Context
This is a market-price question resolving via Trading Economics Brent CFD data if the price prints below $50/bbl at any time in calendar 2026. As of August 25, 2026 (late in the year), the price has not fallen below $50 so far, and remaining-year forecasts from major agencies and banks do not point to that level. Current price is approximately 88–89.3 USD/bbl (down ~3% on August 25 amid diplomatic headlines).[1]
Current Price, Range, and Historical Context (as of ~August 25, 2026):
Brent is trading near 89 USD/bbl after a recent pullback (e.g., Investing.com futures ~88.16; Trading Economics 89.297; various snapshots 88–93 in mid-to-late August). Year-to-date 2026 high reached 126.41 on April 30; 52-week low was 58.56–58.72 (December 16, 2025). Early 2026 prices hovered in the low-to-mid 60s (e.g., ~60.92 on January 2; 63–70 range in late January; ~71–72 in late January/February). Prices then surged above $100 in March (intraday 119.50 on March 9) on the outbreak of the Iran war, infrastructure strikes, and effective Strait of Hormuz closure. They have since retreated but remain well above 50, with 1-year gain ~33–38%. All-time high remains 147.50 (July 2008). Volatility has been elevated due to geopolitics; no 2026 print below ~58–63 appears in available historical series.[11]
Seasonality typically sees softer Q1 demand, but 2026’s remaining period (Q3–Q4) includes winter heating demand that usually supports prices. Past-year data capture a shift from ~60s (late 2025/early 2026) to war-driven spike then partial normalization.
Forward-Looking Forecasts and Wall Street/Agency Consensus (2026 Remaining and Beyond):
- EIA August 2026 STEO (released Aug 11): 2026 Brent average $87 (vs. $69 in 2025); $85 in 3Q26 (raised $11 from prior month due to tighter inventories from Hormuz), $78 in 4Q26, then $69 in 2027 as production recovers and inventories rebuild. Assumes continued Hormuz constraints through August then gradual improvement; most shut-in output back by early 2027. Global liquids production ~106.1 million b/d in 2026. U.S. inventories expected below 5-year lows through year-end.[2]
- J.P. Morgan: $86 (3Q26), $80 (4Q26), $78 year-end.
- Trading Economics models: ~96 by end-Q3 2026, 111 in 12 months.
- Citi (April 2026, still relevant as risk scenario): Base $110/95/80 across remaining 2026 quarters (50% probability); upside to $150 spike/$130 averages if Hormuz stays disrupted.
- IEA August OMR: Demand contraction of 1.6 million b/d in 2026 (revised lower) from high prices, Hormuz effects, and weaker activity; supply down 4.3 million b/d. Market seen swinging toward surplus late-year if Hormuz reopens, but 2026 remains tight. 2027 rebound expected.
Earlier 2025 EIA views (pre-war) had 2026 averages in the $50s, but those were overtaken by the Iran conflict and supply shock.
No major forecast currently sees a drop to $50 in the remaining ~4 months of 2026. 2027 averages cluster around $69.
Recent News and Geopolitical Drivers (August 2026 Focus):
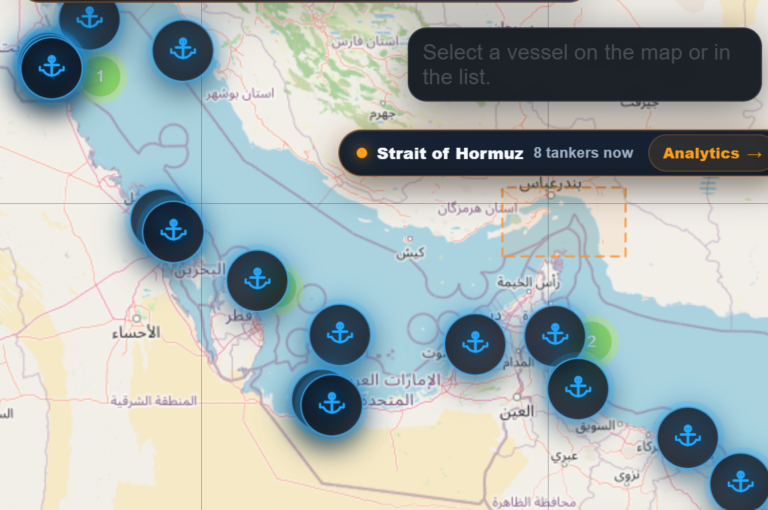
Prices have been highly sensitive to Iran-US developments, Hormuz tanker traffic, and sanctions. Mid-August saw gains to ~$93–94 on Trump threats of retaliation against Iran supporters and stalled talks (e.g., Reuters Aug 20: +2.4% settle at 93.78). Late August brought a drop below $90 (Trading Economics Aug 25: -3% to ~89.5) on possible diplomatic progress (Pakistan army chief visit to Tehran, reports of sanctions-relief proposals) and U.S. measures seen as less severe than feared (Treasury Secretary Bessent on winding-down trade with Iran; China not fully exempt). Hormuz flows remain disrupted but some tanker transits reported, contributing to inventory tightness. IEA and EIA both flag renewed hostilities as an upside-price risk and de-escalation/reopening as a downside risk. Demand destruction from high prices is already occurring (IEA: first annual decline since 2020). OPEC+ and non-OPEC supply (U.S. shale, Americas) provide some offset but have not prevented the 2026 tightness.
Prediction Markets, Odds, and Other Context:
Polymarket activity earlier in 2026 focused on higher prices (e.g., WTI to $110–120 probabilities rising in April amid the spike); no prominent markets found for a sub-$50 print. Live Vegas/sportsbook oil odds are not a primary source here, but futures curves (ICE Brent Oct/Nov/Dec 2026 contracts around 87–91 recently) imply contango/backwardation consistent with gradual easing, not a crash. Company filings and OPEC calendars show ongoing production management but no 2026 collapse scenario.
Movement Toward Resolution and Expert Views:
No evidence of a sub-$50 print in 2026 to date (lowest ~60s early year, then war spike). Recent days show modest downward pressure from de-escalation headlines, but levels remain ~80%+ above the $50 threshold with 4 months left. Authoritative sources (EIA, IEA, JPM, Citi) cluster remaining 2026 prices in the high 70s to mid-90s, with 2027 easing to high 60s—still well clear of 50. A major additional demand collapse, full Hormuz reopening plus supply surge, or recession far deeper than currently modeled would be required for a sub-50 outcome; current assumptions do not include that. High geopolitical volatility remains the key uncertainty, but the resolution source (Trading Economics) and EIA data show no such move yet. Check the Trading Economics page directly for the latest tick as it is the official resolver.
Extracted resolution criteria links:
[‘https://tradingeconomics.com/commodity/brent-crude-oil‘]
=== Forecast Result ===
Brent is around $89, so reaching below $50 would require an unusually large decline of roughly 44% within the remaining four months. The relevant 2026 low so far appears to have been in the high-$50s or low-$60s, and the current futures curve remains far above $50 through December.
The main downside pathway is a rapid Iran–US de-escalation and reopening of the Strait of Hormuz, followed by a sharp inventory rebuild and demand deterioration. However, even forecasts incorporating substantial normalization generally place fourth-quarter Brent in the high-$70s or above. A sub-$50 print would likely require an additional major shock, such as a severe global recession, a much faster-than-expected supply restoration, or a collapse in geopolitical risk combined with substantial excess production.
The most important assumptions are:
- Hormuz-related supply disruption does not resolve dramatically faster than expected: failure probability roughly 20%. A rapid reopening could produce a sharp drop, but getting all the way below $50 would still require considerable follow-through.
- Global demand and inventories do not deteriorate into a severe surplus: failure probability roughly 10%. This is the most plausible non-geopolitical route to $50, but current agency forecasts do not indicate such an outcome.
- The Trading Economics series does not show an anomalous or materially different price than the cited Brent benchmarks: failure probability roughly 2%. Even allowing for differences among spot, futures, and CFD data, the gap to $50 is large.
Given the short remaining horizon, high starting price, and market-implied late-2026 levels, the event is possible but distinctly unlikely. A rough timeframe estimate would be around 1% over the next month and about 3% over the full remaining period; the probability would rise more meaningfully only over a longer 2027 horizon.
Probability: 3%
End
About The Author