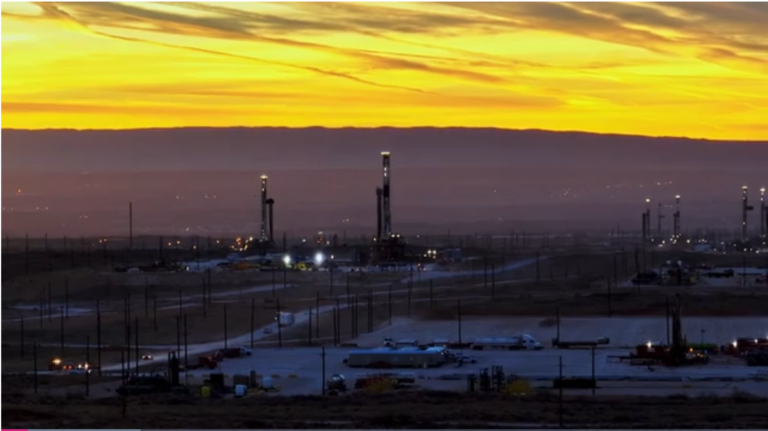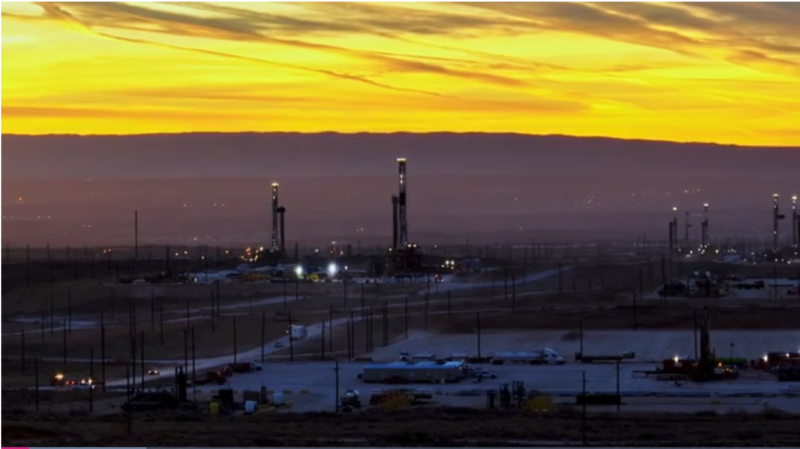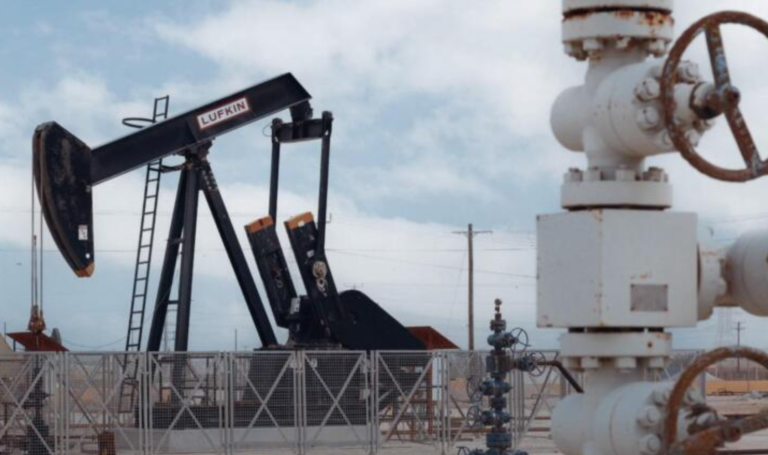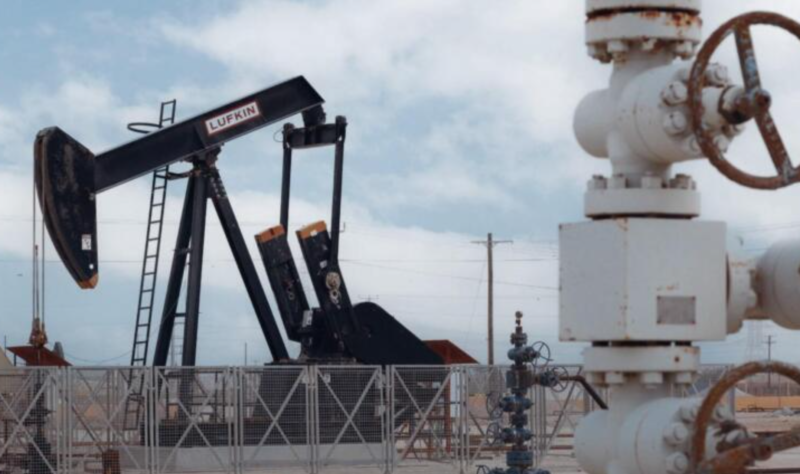
Photo: The Bahrain Field Oil and Gas Development and Expansion Program is a major development project which is expected to be one of the Group’s largest projects in the medium-term, and consists of a number of related oil and gas development projects which are managed in a coordinated manner with a view to maximizing onshore oil and gas production and recovery. Source: https://www.bapcoenergies.com/our-projects/bahrain-field-oil-and-gas-development-and-expansion, Bapco Energies.
DeepSeek research response:
“Brent oil – Price – Chart – Historical Data – News”
Description: Resolution source (TradingEconomics Brent page). Published 27 Oct 2026.
Summary: The page shows Brent at $114.93/bbl on 27 Oct 2026, down 0.76% on the day, +17.48% over the past month and +80.05% year-over-year. Trading Economics’ model forecasts $120.58 for end-Q4 2026 and $138.56 in 12 months, i.e., materially higher, not lower. The accompanying news says Brent fell below $115 as diplomacy picked up around the US–Iran war, with Saudi, Pakistani and Turkish officials meeting in Tehran.
“Brent Crude Oil Price History by Year — Average & Range”
Description: Annual and YTD high/low from daily front-month ICE settlements. Published/refreshed 27 Oct 2026.
Summary: Brent has averaged $90.80/bbl in 2026 YTD, with a 2026 high of $118.35 and a 2026 low of $59.96 (daily closing prices through 27 Oct 2026). For comparison, 2025 averaged $68.10 with a low of $58.92. This dataset shows no 2026 print anywhere near $50; the year’s floor is roughly $10/bbl above the threshold.
“Front Month ICE Brent Crude Fell 0.78% to Settle at $115.81 — Data Talk”
Description: Dow Jones Market Data daily settlement note (via Morningstar). Published 26 Oct 2026.
Summary: Front-month ICE Brent settled at $115.81, the fourth-highest settlement of 2026, and is up 93.15% from the 2026 settlement low of $59.96 hit Wednesday, 7 Jan 2026. It is only 2.15% below the 2026 settlement high of $118.35 (31 Mar 2026) and up 96.55% from the 52-week low of $58.92 (16 Dec 2025). Year-to-date it is up $54.96, or 90.32%.
“NYMEX Overview: Crude Prices Falling on Efforts to De-Escalate Mideast Tensions” (OPIS)
Description: Intraday futures snapshot from OPIS via MarketScreener. Published 26 Oct 2026.
Summary: December Brent was trading $1.70 lower at $115.02/bbl, while the more active January Brent contract was $110.14 — a curve that prices modest easing, not a crash. December WTI was $100.97 and January WTI $98.84. The sell-off followed Saudi Defence Minister Khalid bin Salman’s talks in Tehran, but the article notes continued Houthi attacks on Saudi targets and rising tanker/freight costs.
“World oil prices surge, touching $114/barrel” (Vietnam News Agency – TTXVN)
Description: Market report on the 22–23 Oct price spike. Published 23 Oct 2026 (Vietnamese; 22–23 Oct trading).
Summary: Brent touched $114/bbl on 23 Oct and settled at $113.17 on 22 Oct, the highest since early May, while WTI rose 0.7% to $100.13. The driver was escalating Middle East conflict and fears of energy-supply disruption, plus inflation pressure. This confirms the front-month’s recent range is roughly $96–$118, entirely in the triple digits.
“Short-Term Energy Outlook” (EIA)
Description: Official US government forecast, released 6 Oct 2026, forecast inputs finalised 1 Oct 2026; next release 10 Nov 2026.
Summary: EIA forecasts Brent averaging $105/bbl in Q4 2026 (raised $14/bbl from the prior month) and $96/bbl for 2026 as a whole, falling to $84/bbl in 2027. It assumes Middle East oil flows stay constrained through Q4 2026, with shut-in production in September the lowest since hostilities began, and cites extreme diesel tightness and low inventories as upward price pressure. Nothing in the official forecast contemplates a move toward $50 this year.
Where the resolution source stands today
| Item | Value | As of |
|---|---|---|
| Brent (TradingEconomics CFD) | $114.93 (−0.76% d/d) | 27 Oct 2026 |
| TE Q4 2026 model forecast | $120.58 | 27 Oct 2026 |
| TE 12-month forecast | $138.56 | 27 Oct 2026 |
| ICE Brent front-month settlement | $115.81 (4th highest of 2026) | 26 Oct 2026 |
| Dec Brent / Jan Brent futures | $115.02 / $110.14 | 26 Oct 2026 intraday |
| 2026 YTD low (settlements) | $59.96 (7 Jan 2026) | through 27 Oct 2026 |
| 2026 YTD high (settlements) | $118.35 (31 Mar 2026) | through 27 Oct 2026 |
| 2026 YTD average | $90.80 | through 27 Oct 2026 |
| 52-week low | $58.92 (16 Dec 2025) | — |
Distance to trigger: Brent must fall ~56.5% from $114.93 to $49.99 within roughly nine weeks. The front-month has not printed below $59.96 at any point in 2026, and the last sub-$50 Brent print of any kind was in April 2020. Since 2021, annual lows have been $51.09 (2021), $76.10 (2022), $69.19 (2023), $69.19-ish (2024: $69.19), $58.92 (2025) — i.e., no sub-$50 year in six years.
Context: 2026 is an exceptionally high-volatility year — the $59.96–$118.35 range is ~64% of the $90.80 average. That cuts both ways, but even the violent Q2 unwind (a ~50% peak-to-trough move from ~$126 to ~$70) stopped well above $50.
Downside (would need to be extreme): formal US–Iran ceasefire or MOU revival; full Strait of Hormuz normalisation; return of Iranian barrels (~50 mb already shipped since the blockade lifted, per Petroleum Economist); OPEC+ accelerating the unwind of the 2023 cut; US midterm elections (early Nov) reducing the administration’s appetite for strikes; a G7-coordinated reserve release (G7 announcement 2 Oct not yet in EIA’s baseline; US SPR release was only 400 kb).
Upside (currently dominant): renewed US/Israeli strikes on Iran after the midterms; Houthi attacks on Saudi Aramco facilities and tankers; East–West pipeline damage; diesel crack spreads and low OECD inventories; only ~4 mb/d OPEC+ spare capacity, which caps how much supply can offset disruptions.
Bottom line for context (not a forecast): the 2026 low is $59.96, roughly 17% above the trigger; the current price is ~$115, roughly 130% above it; the official US forecaster sees Q4 2026 at $105 and 2027 at $84; and the most bearish credible year-end bank target published this year was $60.
Extracted resolution criteria links:
[‘https://tradingeconomics.com/commodity/brent-crude-oil’]
=== Forecast Result ===
Reasoning:
This question is now almost entirely resolved by historical data, since the full year 2026 price path from January through October 27 is already known, leaving only ~65 days remaining.
Key facts:
- Current Brent price: ~$114.93-115.81 (resolution source and ICE settlement, Oct 26-27, 2026)
- 2026 YTD low: $59.96 (settled January 7, 2026) — confirmed by multiple independent sources (Dow Jones Market Data, TradingEconomics chart, vision analysis)
- 2026 YTD high: $118.35 (March 31, 2026)
- No sub-$60 print has occurred at any point in 2026, even during the Q2 ~30% collapse after the Iran ceasefire (bottomed ~$70-72)
- Current geopolitical environment: active US-Iran conflict, Houthi attacks on Saudi infrastructure, tight diesel markets, low OECD inventories — all strongly bullish for oil prices
- All credible forecasts for Q4 2026/year-end are far above $50: EIA Q4 $105, Goldman $90, even the most bearish call (Citi, made during a ceasefire period) was $60-65
- Futures curve (Dec/Jan 2027 contracts) shows $110-115, implying market expects continued elevated prices, not a collapse
Analysis for remaining ~65 days:
For this question to resolve Yes, Brent would need to fall from ~$115 to below $50 — a decline of ~57% — within about nine weeks. This would require a shock of a magnitude comparable to the 2008 GFC (demand collapse) or 2020 COVID+Saudi-Russia price war (demand collapse + supply flood), events that are historically rare and typically unfold over longer periods with substantial lead indicators. Currently, supply is constrained (not in surplus), geopolitical risk premium is elevated and rising, OPEC+ is making only modest supply additions, and inventories are tight (especially diesel). There is no plausible near-term catalyst (within 9 weeks) that would reverse this environment so dramatically.
Even a hypothetical full and immediate resolution of the Iran conflict with complete Hormuz normalization would likely only bring prices into the $60-80 range based on analyst modeling (Citi, Goldman, Morgan Stanley), not below $50.
Assumptions whose failure would most alter the forecast:
- No sudden demand shock (recession/pandemic-level) – probability of such a shock materializing and fully transmitting to price within 65 days: ~1%
- No sudden OPEC+ price war / supply flood – given current tight market and modest unwind pace, probability of a sudden strategy shift to max-output flooding: ~1%
- Geopolitical de-escalation doesn’t fully normalize AND combine with a demand collapse simultaneously – compound event probability: <1%
Given these are largely independent low-probability tail risks, and the sheer magnitude of decline required in a very short window, the probability of Yes resolution is very low, but not zero given extreme volatility already witnessed in 2026 (various swings of 30-50% within the year).
Data sufficiency: Sufficient
Probability: 2%
End
About The Author