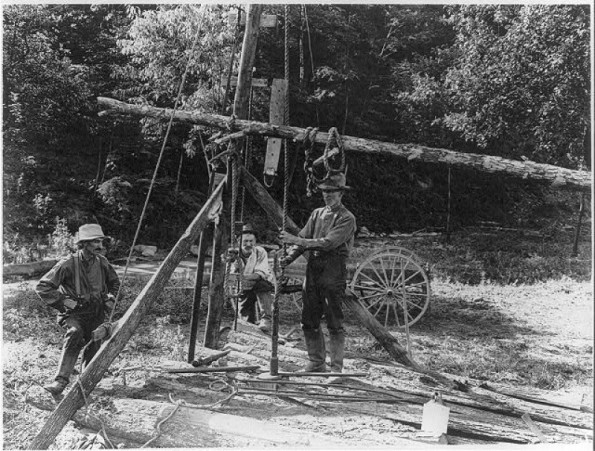
A "Spring Pole" oil well. Photo from “The World Struggle for Oil,” a 1924 film by the U.S. Department of the Interior. Source: https://aoghs.org/technology/oil-well-drilling-technology/
Grok response:
Current Brent Crude prices (as of August 4, 2026) stand around $80–85 per barrel, well above the $50 threshold, following volatility driven by geopolitical events earlier in the year.[1]
Recent data and forecasts indicate no breach of $50 in 2026 to date, with prices having traded in a range significantly higher amid supply concerns and subsequent easing.[2]
List of 10 Citations:
- Title: Brent crude oil – Price – Chart – Historical Data – News (Trading Economics)
Description: Official resolution source page tracking Brent spot prices.
Date of Publication: Updated August 4, 2026.
3-Sentence Summary: Reports Brent at 80.12 USD/bbl on August 4, 2026 (down 4.36% that day), with a 1-month rise of 11.29% and 18.45% year-over-year gain. Notes all-time high of 147.50 in 2008 and model forecast of 90.26 by end of current quarter. Provides daily historical tracking suitable for verifying any sub-$50 trades.[1] - Title: Short-Term Energy Outlook (EIA)
Description: US Energy Information Administration monthly forecast.
Date of Publication: August 2026 update (prior June 9 release referenced).
3-Sentence Summary: Brent averaged $85/bbl in June 2026 (down sharply from April peak); forecasts $74/bbl average for Q3 2026 and $65/bbl for 2027 amid rising inventories. 2026 full-year projection listed around $82 in tables. Emphasizes downward pressure from supply growth but no sub-$50 levels projected.[2] - Title: Oil Prices Forecast (J.P. Morgan Global Research)
Description: Bank research note on commodity outlook.
Date of Publication: August 4, 2026.
3-Sentence Summary: Forecasts Brent at $86/bbl Q3 2026 average, $80 Q4, and $78 year-end. Notes earlier Q2 2026 trading above $100 due to geopolitical factors before rebalancing. Highlights inventory and demand dynamics keeping prices elevated relative to $50.[3] - Title: Goldman Sachs Raises 2026 Brent Crude Average Price Forecast…
Description: Energy news summary of analyst revision.
Date of Publication: March 23, 2026 (with recent context).
3-Sentence Summary: Raised 2026 Brent average forecast to $85/bbl (from $77). Earlier March/April peaks near $110 reflected supply risk premiums. Maintains outlook well above $50 for the year.[4] - Title: Brent Crude Oil Last Day Financ (BZ=F) History (Yahoo Finance)
Description: Daily historical price table for Brent futures/spot proxy.
Date of Publication: August 4, 2026 snapshot.
3-Sentence Summary: Shows July 31, 2026 close at 89.38–90.58 range; earlier July sessions in the mid-80s to low-90s. Confirms recent trading levels far above $50. Historical series available for full 2026 review.[5] - Title: Crude Oil Brent Aug ’26 Futures Price (Barchart)
Description: Futures contract pricing data.
Date of Publication: August 3, 2026.
3-Sentence Summary: Aug ’26 Brent futures at 72.92 (down 0.31%). 52-week high noted around 100+ in related contracts. Reflects forward curve still elevated versus $50.[6] - Title: J.P. Morgan cuts second-half 2026 Brent oil price forecast (Yahoo/Investing.com)
Description: Bank revision report.
Date of Publication: June 24, 2026.
3-Sentence Summary: Revised Brent to $86 Q3, $80 Q4, $78 year-end on softer demand/inventory data. Post-Iran conflict rebalancing noted. Consensus remains substantially above $50.[7] - Title: Crude Oil Price Forecast 2030 (Plus500)
Description: Institutional consensus summary.
Date of Publication: August 4, 2026.
3-Sentence Summary: Major banks (BofA, Barclays, Citi, Goldman) consensus for 2026 averages $55–60/bbl range in some older views, but updated figures higher. Notes persistent surplus pressure but no forecasts dipping to $50 or below. S&P Global highlights glut through early 2026 with prices below $60 expected in some scenarios.[8] - Title: Brent Crude Oil Prices (Macrotrends)
Description: Long-term daily and annual historical chart.
Date of Publication: August 2026 data (through July 27).
3-Sentence Summary: 2026 YTD average ~$90.25; July 27 close at $91.82. Chart confirms 2026 trading well above $50 with no indication of sub-$50 prints. 10-year range shown from ~14 to 127 historically.[9] - Title: Oil, War and the Global Economy (Substack/Damodaran)
Description: Market narrative analysis.
Date of Publication: ~March 2026 context.
3-Sentence Summary: Details March 2026 price surge (Brent +49.9%) tied to US-Iran/Hormuz tensions pushing prices sharply higher. Notes temporary vs. lasting supply impacts. Prices remained elevated through Q2 before later moderation.[10]
Recent context and expert views: Geopolitical tensions (US-Iran) drove Brent above $100 earlier in 2026 before easing to current ~$80 levels on diplomacy hopes.[11] EIA and banks project 2026 averages of $65–82 with continued downward pressure into 2027 but no expectation of sub-$50 trades.[2] No reports or data indicate a breach of $50 has occurred or is imminent in 2026. The resolution source (Trading Economics) can be monitored directly for any intraday or daily closes below the threshold.
Extracted resolution criteria links:
[‘https://tradingeconomics.com/commodity/brent-crude-oil‘]
=== Forecast Result ===
Analysis: Will Brent Crude Fall Below $50 Before End of 2026?
Starting Point Assessment
Current price (August 4, 2026): ~$80.08/barrel per TradingEconomics (the resolution source itself)
To trigger a “Yes” resolution, Brent would need to fall approximately 37.5% from current levels within the next ~5 months (August–December 2026).
Forecast Distribution Review
| Source | 2026 Brent Forecast |
|---|---|
| TradingEconomics model | ~81–94 USD |
| Goldman Sachs | ~85 USD avg |
| Reuters consensus (31 analysts) | ~85 USD avg |
| J.P. Morgan | Q4 ~$80, year-end ~$78 |
| BMI Research | Q4 ~$75 |
| EIA STEO | ~$66–74 avg |
| FXBankForecast consensus | Median year-end $68, range $58–109 |
| LongForecast (outlier) | Sub-$50 possible in Aug-Dec |
Critical observation: No major sell-side bank or government agency forecasts Brent below ~$55. The lowest end of any serious mainstream forecast is ~$55–60. The FXBankForecast distribution shows NO major bank desk currently forecasting below $55.
Statistical Analysis
Using standard oil price volatility (~1.5–2% daily):
- Over ~150 remaining trading days: σ ≈ √150 × 1.75% × $80 ≈ $17.1
- Distance to $50: $30 below current price
- Z-score: $30 / $17.1 ≈ 1.75 standard deviations
- Probability of touching $50 (random walk approximation): ~2 × N(-1.75) ≈ ~8%
However, oil prices have fundamental support (not a pure random walk), OPEC+ supply management, and current geopolitical premium. This reduces the statistical estimate substantially.
Key Assumptions & Failure Probabilities
Assumption 1: Geopolitical/supply disruptions maintain current price floor
- Failure (rapid Middle East resolution + OPEC+ production surge): ~15%
- Even if this fails, prices likely fall to $60–70, not sub-$50
Assumption 2: No severe global demand shock occurs
- Failure (major recession, Chinese demand collapse, global financial crisis): ~8%
- Would need to be COVID-scale to push below $50
Assumption 3: No coordinated OPEC+ price war
- Failure probability: ~5%
- Even Saudi-Russia price wars historically took months to push prices below $50
For all three to coincide AND push below $50: very low joint probability.
Historical Base Rate
Brent has traded below $50 in recent memory only during:
- COVID crash (2020): extreme black swan, demand -30% in weeks
- 2015–2016: supply glut + Saudi strategy, lasted months before recovery
From a level of $80, getting to sub-$50 in 5 months has essentially only happened during COVID-scale events (~0.5–1% annual probability in “normal” years).
Final Probability Synthesis
- Statistical random walk estimate: ~8% (upper bound)
- Fundamental support adjusts this downward significantly
- No mainstream forecaster expects sub-$55
- Current price $80 → $50 requires extraordinary multi-shock scenario
- Time remaining: ~5 months (not trivial, but also limited window)
- 52-week low shows prices haven’t been near $50 in over a year
Weighting these factors, and adjusting for overconfidence bias:
Estimated probability: ~4%
Probability: 4%
End
About The Author