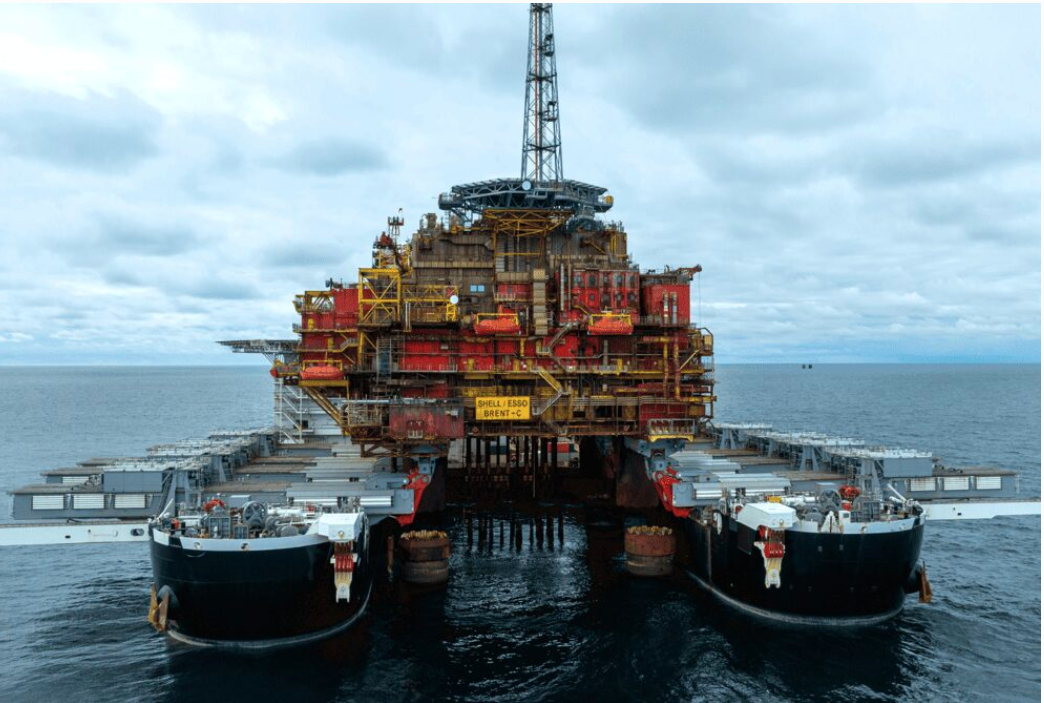
The decommissioning of Shell‘s iconic Brent oil and gas field in the North Sea has reached a significant milestone with the successful removal of the Brent Charlie platform topsides. Source: https://petroleumaustralia.com.au/projects/shells-brent-field-decommissioning-reaches-milestone-with-final-platform-removal/
Grok response:
The price of Brent crude has not traded below $50 per barrel at any point in 2026 so far (as of September 22), with the year’s lowest levels near $60 in early January. Current prices near $99 and official forecasts for the remainder of the year remain far above that threshold amid ongoing Middle East supply constraints.
Current price and resolution-source status (September 22, 2026):
Trading Economics (the stated resolution source) shows Brent at approximately $98.75 per barrel, down about 1.6% on the day, up roughly 7% over the past month and 46% year-over-year. Its model-based forecast has Brent at $104.41 by the end of the current quarter and $122.78 in 12 months. ICE front-month futures have recently traded in a similar range (settling near $100.34 on September 21), with intraday moves dipping toward the high $90s on diplomacy headlines.
2026 price range and history:
The 2026 settlement low for front-month ICE Brent was $59.96 on January 7 (intraday lows near $59.45–$59.81). Spot prices that week were in a comparable band (around $61). After the late-February outbreak of the US-Israel conflict with Iran and Strait of Hormuz disruptions, prices spiked, with a 2026 settlement high near $118.35 (March 31) and peaks above $126. A June low reached about $76.47. August spot averaged roughly $91 (EIA). The 52-week range is approximately $58.72–$126.41. Year-to-date gains exceed 60%. No credible data series shows a print below $50 (or even $55) in calendar 2026.
Recent market drivers (mid-to-late September 2026):
Prices have eased from recent highs near $109–$110 on hopes of US-Iran diplomacy around the UN General Assembly, reports of higher Saudi loadings through Hormuz (around 2.9 million b/d recently), and progress toward restarting Saudi Arabia’s East-West pipeline after drone attacks. Volatility remains elevated. Speculative net longs in Brent are near multi-month highs. Analysts describe the latest declines as partly short-covering rather than a fundamental regime shift, with product markets (especially distillates) still tight.
Forecasts and expert views for the rest of 2026:
- EIA September 2026 Short-Term Energy Outlook (released September 9; inputs finalized September 3) projects a full-year 2026 Brent spot average of $91 and roughly $90 in the second half, supported by continued inventory draws (estimated cumulative draw of ~400 million barrels year-to-date, with further draws expected through year-end). It assumes Middle East export constraints persist through 4Q26 (shut-ins averaging about 5.7 million b/d that quarter) before gradual recovery, with the average falling to $74 in 2027.
- A late-June Reuters poll of 31 analysts put the 2026 average at $84.50, with Q4 near $79 (these figures predated the prolongation of disruptions that led EIA to raise its outlook).
- June bank revisions (made when reopening hopes were stronger) included JPMorgan at $86 (Q3) / $80 (Q4) / $78 year-end exit; Morgan Stanley at $75 for both Q3 and Q4; Goldman Sachs at $80 for Q4; Barclays at $96 for the year; and UBS at $85 for end-September and end-December. More recent commentary (mid-September) from Morgan Stanley has referenced a $100 Q4 average with upside risks from tight balances.
- Trading Economics’ own models point higher in the near term. No major institutional forecast or stressed scenario in recent reports projects averages or sustained trading near or below $50 for the balance of 2026. A move below $50 would require an extreme, currently unforecast demand collapse or supply surge well beyond even the more bearish June scenarios.
Historical context and seasonality:
Annual averages were roughly $69 in 2025, $80–$81 in 2024, and $82 in 2023 (EIA/FRED and related series). The COVID-era collapse (2020 average near $42, with much lower troughs) was driven by an unprecedented demand shock that is not present in current balances. Q4 seasonality can be supportive via winter heating demand, but geopolitics and inventory trends dominate the 2026 outlook. Implied volatility has been historically elevated.
Indication of movement toward resolution:
With more than nine months of 2026 elapsed, the observed low near $60, current levels near $99, ongoing inventory draws, and consensus/official forecasts clustered in the $75–$100 range for the remainder of the year, recent developments do not point toward a sub-$50 print. Downside risks exist if Hormuz flows normalize rapidly and a surplus emerges, but even those paths in published analyses stay well above $50. Upside risks from further disruptions remain material.
Citations:
- Brent oil – Price – Chart – Historical Data – News (Trading Economics). Published/updated September 22, 2026. Description: Live benchmark page used for resolution. Brent fell to about $98.75 on September 22, 2026 (down 1.59% on the day, up 7% month and 46% year). Models forecast $104.41 by quarter-end and $122.78 in 12 months. Historical all-time high cited at $147.50 (2008).
- Front Month ICE Brent Crude Fell 3.40% to Settle at $100.34 — Data Talk (Morningstar / Dow Jones). Published September 21, 2026. Description: Settlement data summary. Front-month ICE Brent settled at $100.34 after a 3.4% drop. 2026 settlement low was $59.96 on January 7; 2026 high was $118.35 on March 31. Year-to-date gain of about 65%; 52-week low was $58.92 in December 2025.
- Short-Term Energy Outlook (U.S. Energy Information Administration). Released September 9, 2026 (forecast completed September 3). Description: Official U.S. government energy forecast. Brent spot projected to average $91 in 2026 and around $90 in 2H26, supported by inventory draws of hundreds of millions of barrels and assumed Middle East constraints through 4Q26. Average expected to ease to $74 in 2027 as production recovers.
- Analysts dial down oil forecasts as Hormuz reopening eases supply concerns: Reuters poll (Reuters). Published June 30, 2026. Description: Survey of 31 economists and analysts. 2026 Brent average cut to $84.50 (from $90.44 the prior month). Analysts saw easing from about $84 in Q3 to around $79 in Q4, then mid-$70s by mid-2027, contingent on supply normalization.
- JP Morgan cuts H2FY26 brent forecast, sees year-end price at $78 (Mettis Global / related coverage). Published June 25, 2026. Description: Bank research note summary. JPMorgan lowered its outlook to $86 in Q3 and $80 in Q4, exiting 2026 at $78, citing weaker inventory draws and larger demand losses than expected, with flows recovering but surplus risks later.
- Morgan Stanley Cuts Brent Forecast to $75 a Barrel (OilPrice.com). Published June 30, 2026. Description: Coverage of bank revision. Morgan Stanley cut Dated Brent to an average of $75 in both Q3 and Q4 (further cuts from mid-June levels), expecting Hormuz reopening to accelerate a supply glut; Goldman simultaneously cut its Q4 view to $80.
- Oil rises slightly ahead of potential US-Iran talks (Reuters). Published September 22, 2026. Description: Market report. Brent November futures rose modestly early in the session (around $101) before later pressure, as traders watched UN General Assembly diplomacy and higher weekend Hormuz flows. Analysts described moves as sensitive to headlines with elevated volatility.
- Oil prices – historical Brent Oil data (LiveCharts). Data through early 2026 (page accessed in context of September 2026 searches). Description: ICE futures historical series. Early-January 2026 closes clustered near $60–$63, with the January 7 low/close at $59.96 and intraday low near $59.81. Confirms the year’s trough occurred well before the conflict-driven spike.
- Oil Prices Reverse Course as Traders Watch US-Iran Diplomacy (OilPrice.com). Published September 22, 2026. Description: Intraday market commentary. Prices reversed higher at times near $101–$102 on diplomacy hopes after multi-day declines, with analysts noting short-covering and still-bullish speculative positioning (net longs near the highest since May).
- EIA sees Brent near $90/bbl in second-half 2026 amid Middle East disruptions (Oil & Gas Journal, summarizing EIA). Published around September 10, 2026. Description: Coverage of the September STEO. EIA raised its 2H26 Brent view to about $90 (up $8 from the prior month) because of larger inventory draws and extended assumptions of constrained Middle East exports and production shut-ins into late 2026, with gradual declines expected only in 2027.
Extracted resolution criteria links:
[‘https://tradingeconomics.com/commodity/brent-crude-oil‘]
=== Forecast Result ===
=== Reasoning ===
To forecast whether Brent Crude will fall below $50 per barrel at any point in 2026, we examine the historical price action year-to-date, current market fundamentals, and the plausibility of tail-risk scenarios occurring over the remaining ~100 days of the calendar year.
Current Status and 2026 Historical Context
- Year-to-Date Lows: Historical settlement data and financial reports confirm that Brent Crude’s lowest level in 2026 occurred in early January at approximately $59.96 per barrel (with intraday lows near $59.45–$59.81). Following geopolitical conflict and export disruptions in the Middle East starting in late February, prices surged to peaks above $118–$126 per barrel. Even during pullbacks in June and July, the troughs remained above $76–$78 per barrel.
- Current Level: As of September 22, 2026, Trading Economics and ICE front-month futures place Brent at approximately $98.50–$100.30 per barrel.
- Required Move: For the contract to resolve “Yes,” the price must fall from around $98.50 to below $50.00—a decline of nearly 50%—in approximately 14 weeks (by December 31, 2026).
Fundamentals and Expert Outlooks
- Supply/Demand Balances: Official agencies (such as the EIA’s September 2026 STEO) estimate that cumulative global crude inventory draws year-to-date have exceeded hundreds of millions of barrels, with continued tightness expected through Q4 2026. The EIA projects Brent to average around $90 in the second half of 2026.
- Analyst Scenarios: Even the most bearish bank forecasts published during periods of diplomatic optimism (e.g., Morgan Stanley, Goldman Sachs, JPMorgan) project Q4 2026 prices in the $75–$80 range, assuming a full reopening of the Strait of Hormuz and a gradual return of shut-in production.
- Seasonality: Q4 typically sees seasonal support from Northern Hemisphere winter heating demand and refinery runs.
Precedents for a 50% Drop in ~100 Days
A roughly 50% decline within ~3 months is historically rare for crude oil, occurring almost exclusively during severe, systemic global shocks:
- Late 2008 (Global Financial Crisis): The sudden freeze of global credit and collapse in industrial demand.
- March–April 2020 (COVID-19 + OPEC+ Price War): Worldwide lockdown demand destruction combined with an uncoordinated surge in Saudi and Russian production.
Neither an immediate global macroeconomic collapse nor an unconstrained producer price war appears in baseline projections. Even if full diplomatic resolution in the Middle East occurs swiftly, major OPEC+ producers face fiscal breakeven levels well above $70–$80/bbl and have strong incentives to manage supply rather than trigger a price collapse.
Timeline Breakdown
- Within 1 month (by late October 2026): <0.5% (insufficient time for supply-demand balances to shift so drastically).
- By year-end 2026 (~3.3 months): ~2% (requires a compounding catastrophic shock: immediate peace + producer price war + sudden global recession).
- Within 1 year (by late 2027): ~10–15% (substantially higher as supply normalizes, non-OPEC output expands, and cyclical slowdowns materialize).
Key Assumptions & Sensitivity Analysis
- Brent did not trade below $50 earlier in 2026: (Assumed True). Probability of error: <0.5%. Extensive multi-source documentation verifies the YTD low is near $59.50.
- No global systemic economic collapse (e.g., pandemic or rapid financial panic) unfolds in Q4 2026: Probability of assumption failure: ~1.5%.
- OPEC+ will not initiate a predatory market-share price war if regional tensions de-escalate: Probability of assumption failure: ~1.5%.
Factoring in fat-tailed commodity volatility, potential intraday liquidity flash crashes, and black swan event risk, the probability remains low but non-zero.
Data sufficiency: Sufficient
Probability: 2%
End
About The Author