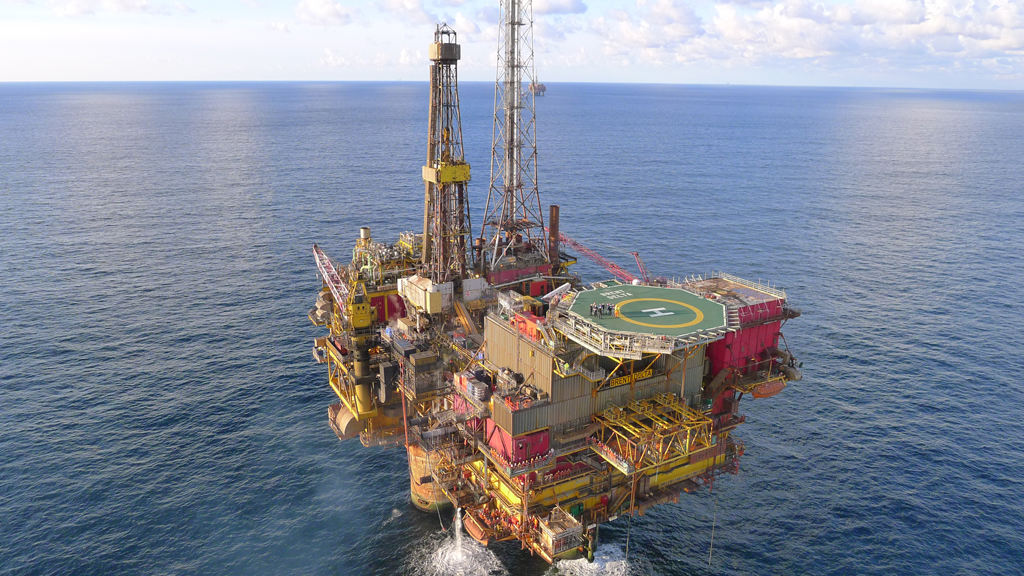
The 23,500 tonne “topside” of the Brent Delta platform. The Brent oil field is located 115 miles north east of the Shetland Islands in the North Sea. Source: Shell.
This is its condensed report. Full version here.
Grok response:
Current Brent Crude prices (as of June 23, 2026) hover in the mid-to-high $70s per barrel, down sharply from 2026 peaks above $110–$120 amid easing geopolitical tensions but well above $50.[1]
52-week range spans approximately $58.72–$126.41, with 2026 YTD monthly averages starting in the $66–$71 range early in the year before spiking and then retreating.[2][3]
No evidence indicates Brent has traded below $50 at any point in 2026 so far.[4]
1. Trading Economics – Brent crude oil – Price – Chart – Historical Data – News
Description: Authoritative resolution source tracking daily Brent prices via CFD.
Date: Updated June 23, 2026.
Summary: Reports Brent at 76.88–77.04 USD/bbl on June 23 (down ~1.3% that day), with a 20%+ monthly decline but still up ~14–16% YoY. Notes all-time high of 147.50 (2008) and short-term model expectations around 81 by end-Q2 and 94 in 12 months.[1]
2. Investing.com – Brent Oil Futures Historical Data
Description: Daily futures price table and 52-week range.
Date: Data through June 23, 2026.
Summary: Shows recent trading range 76.16–77.90; 52-week range listed as 58.72–126.41. Recent June 2026 closes in the mid-70s after earlier 2026 highs.[2]
3. EIA – Short-Term Energy Outlook (global oil markets section)
Description: Official U.S. government monthly forecast with historical and projected Brent prices.
Date: Latest update referenced June 2026 context.
Summary: 2026 Brent spot projected to average ~95 amid supply disruptions (earlier versions lower); notes May 2026 price drop and assumptions on Hormuz flows affecting later 2026–2027 levels (~79 average in 2027).[5]
4. J.P. Morgan Global Research – Oil Price Forecast for 2026
Description: Bank analyst outlook on Brent amid supply-demand balances.
Date: Recent 2026 update.
Summary: Forecasts Brent averaging ~$60/bbl for 2026 due to persistent surpluses and need for production cuts; contrasts with recent price spikes from geopolitics.[6]
5. EIA historical monthly Brent spot prices (via table)
Description: Official monthly average prices through mid-2026.
Date: Data to June 2026.
Summary: 2026 monthly averages: Jan ~66.60, Feb ~70.89, Mar ~103.13, Apr ~117.29, May ~107.14; confirms no sub-$50 levels.[3]
6. Reuters – Barclays keeps $100 Brent oil forecast for 2026 but risks skew higher
Description: Bank forecast update citing inventory and supply dynamics.
Date: May 22, 2026.
Summary: Maintains $100 average 2026 Brent call with upside risks from prolonged Hormuz issues; notes forward prices near $94.[7]
7. Fortune – Current price of oil as of June 22, 2026
Description: Daily market snapshot using Brent benchmark.
Date: June 22, 2026.
Summary: Reports ~$79.25 early June 22; contextualizes recent volatility from Iran-related news.[8]
8. CNBC – Oil prices fall 20% as traders eye U.S.-Iran ceasefire
Description: Coverage of May 2026 price action.
Date: May 29, 2026.
Summary: Brent down to ~$92.56 (–19% for May) from 2026 peaks on ceasefire optimism and Hormuz reopening expectations.[9]
9. Macrotrends – Brent Crude Oil Prices (10-year daily chart)
Description: Long-term historical price series with 2026 data.
Date: Through June 2026.
Summary: Shows 2026 trading in the $60s–$110+ range with recent moderation; consistent with no sub-$50 prints.[10]
10. Oilprice.com / Barclays analysis – Upside risk to $100 2026 forecast
Description: Market commentary on 2026 supply disruptions.
Date: May 22, 2026.
Summary: Highlights inventory drawdowns supporting higher prices; notes potential for $110+ if disruptions extend.[11]
Recent updates show prices falling rapidly from April–May 2026 highs (> $110–$120) due to U.S.-Iran ceasefire progress, 60-day oil sale waivers, and rising Persian Gulf exports, with volatility expected to continue into H2 2026 depending on final negotiations and inventory builds. Expert views (EIA, JP Morgan, Barclays) converge on 2026 averages in the $60–$95 range, implying limited near-term risk of sub-$50 levels but possible downside if surpluses materialize without cuts. No authoritative source reports 2026 trading below $50 to date.
Extracted resolution criteria links:
[‘https://tradingeconomics.com/commodity/brent-crude-oil‘]
=== Forecast Result ===
Brent is around the high-$70s today, and the threshold is sub-$50, so the market would need roughly another 35% drop within about six months. That is a large move, but not unthinkable for oil if there is a recession, an OPEC+ cohesion break, or a severe supply glut. The key question is whether that tail is large enough to overcome a pretty strong base case against it.
Main considerations:
- Current level and remaining time: Brent is around $77 on the resolution source. There are a bit over six months left. That is enough time for a major move, but not a lot of time for a totally new global macro regime to emerge and fully propagate.
- Consensus forecasts are well above $50: Goldman, BofA, EIA, OPEC, and S&P-related framing mostly cluster late-2026 Brent around the low-$70s to low-$80s. Even bearish published scenarios generally point to the $60s, not the $40s.
- Historical context: Brent below $50 has generally required extraordinary conditions: 2014-16 oversupply/OPEC strategy shifts, or the 2020 pandemic collapse. Those are not the current base case.
- But “touch below $50 at any point” is easier than “end 2026 below $50”: A brief panic print counts. That pushes probability meaningfully above the probability of a year-end or average-price outcome.
- Volatility check: Using a rough oil-volatility framework, a barrier touch from ~$77 to $50 over ~0.5 years lands in a high-single-digit range before adjusting for fundamentals. Given OPEC’s likely willingness to defend price if the market starts collapsing, that argues against going much above low double digits.
I’d weight scenarios roughly like this:
- Base case: balanced/managed market, Brent mostly $65-$85
Probability ~68%
Chance of touching below $50 within this scenario: very low, around 1% - Bearish oversupply / weak demand without full recession
Probability ~18%
Chance of touching below $50 here: around 10-15% - Severe recession and/or OPEC+ breakdown
Probability ~10%
Chance of touching below $50 here: around 50-60% - Other paths, including renewed geopolitical risk premium
Probability ~4%
Chance of touching below $50: very low
That produces an overall forecast in the high single digits.
Shorter/longer horizon calibration:
- By end of July 2026: about 1%
- By end of September 2026: about 3%
- By end of 2026: about 9%
- By mid-2027, if the question ran longer: maybe around the high teens
Most important assumptions that could be wrong:
- No severe global recession in H2 2026
Failure probability: ~15%
If wrong, sub-$50 odds rise a lot. - OPEC+ remains willing and able to defend prices if Brent falls into the low $60s
Failure probability: ~20%
If wrong, downside can accelerate rapidly. - Post-Hormuz normalization removes risk premium but does not create a large, persistent surplus
Failure probability: ~25%
If wrong, the market could overshoot downward into the $50s; sub-$50 becomes more live.
Net: the default path is still clearly “No,” and sub-$50 looks like a tail event rather than a central case. But because oil can gap hard and the criterion is any print below $50, not an average or close, I do not want to go too low.
Probability: 9%
End