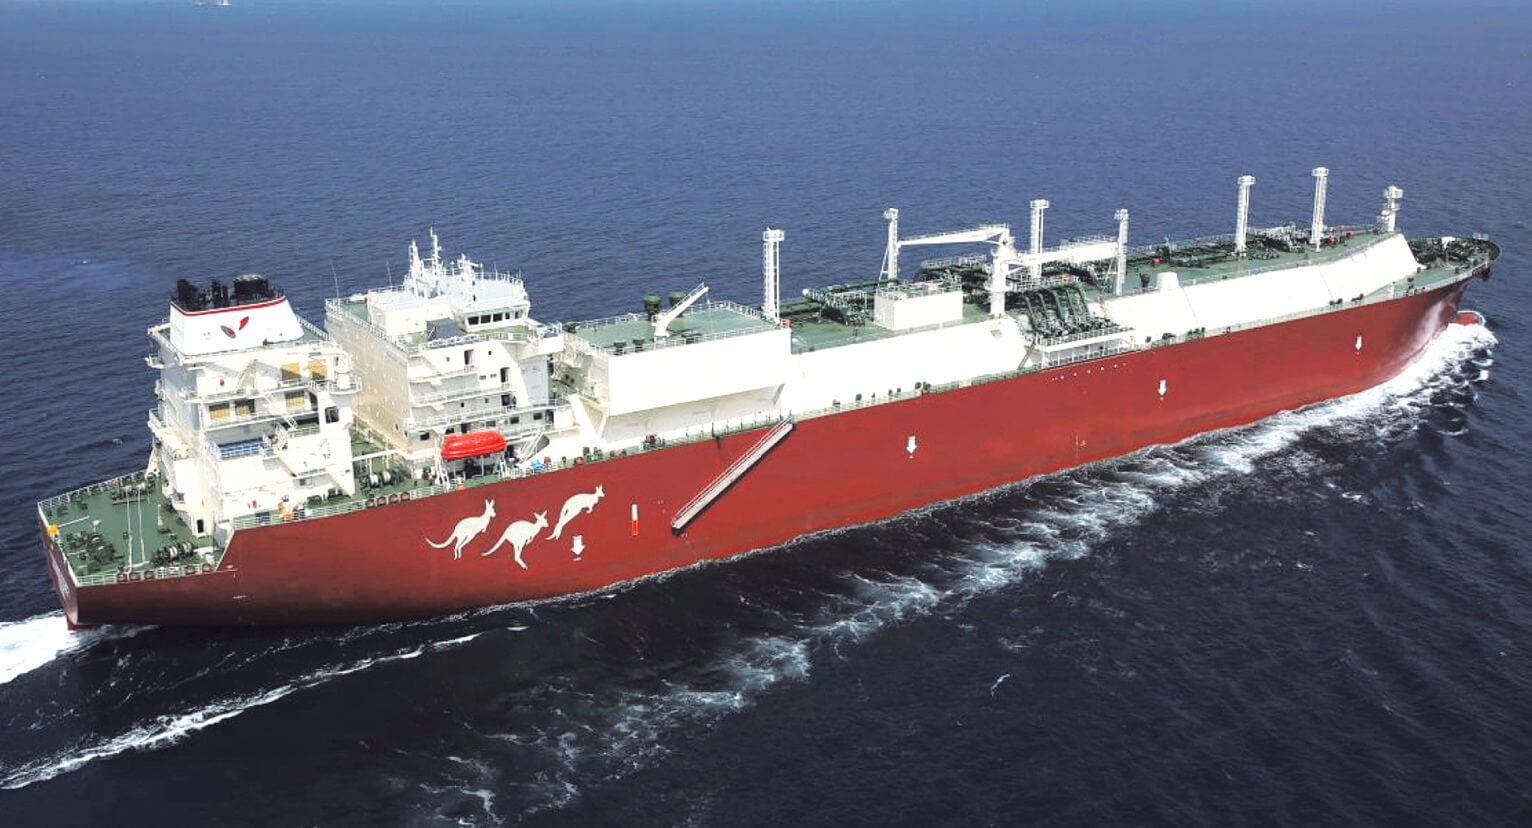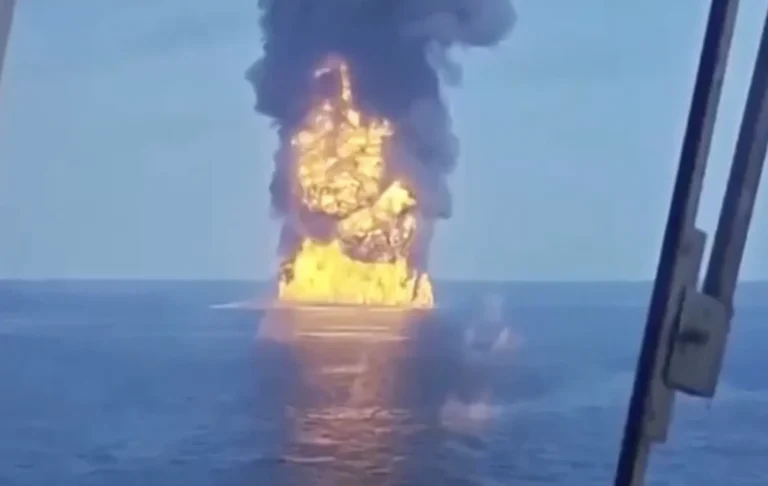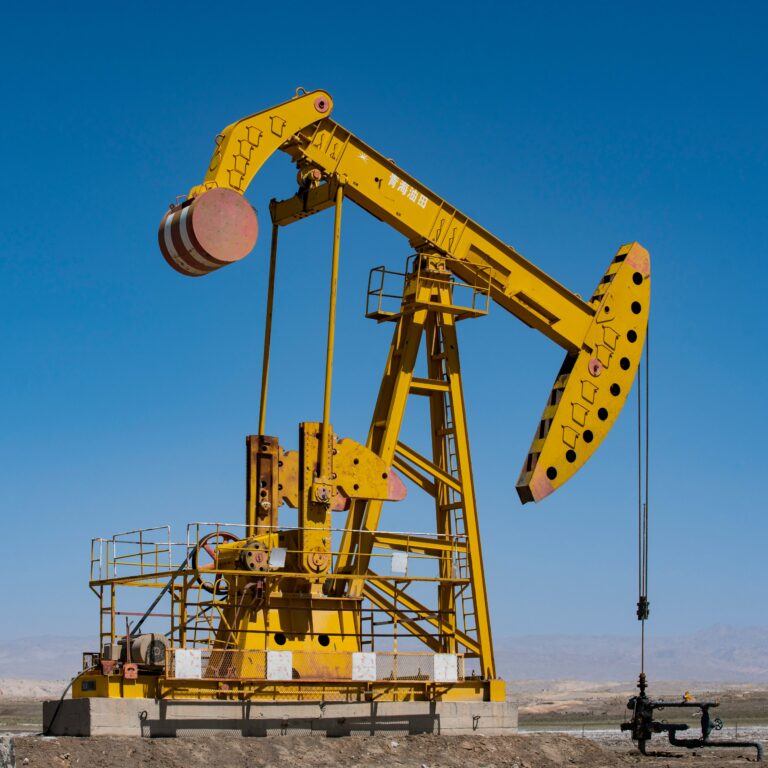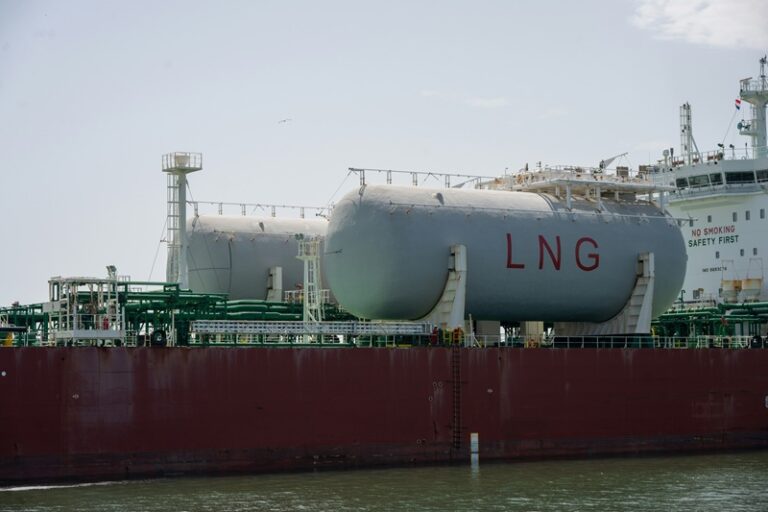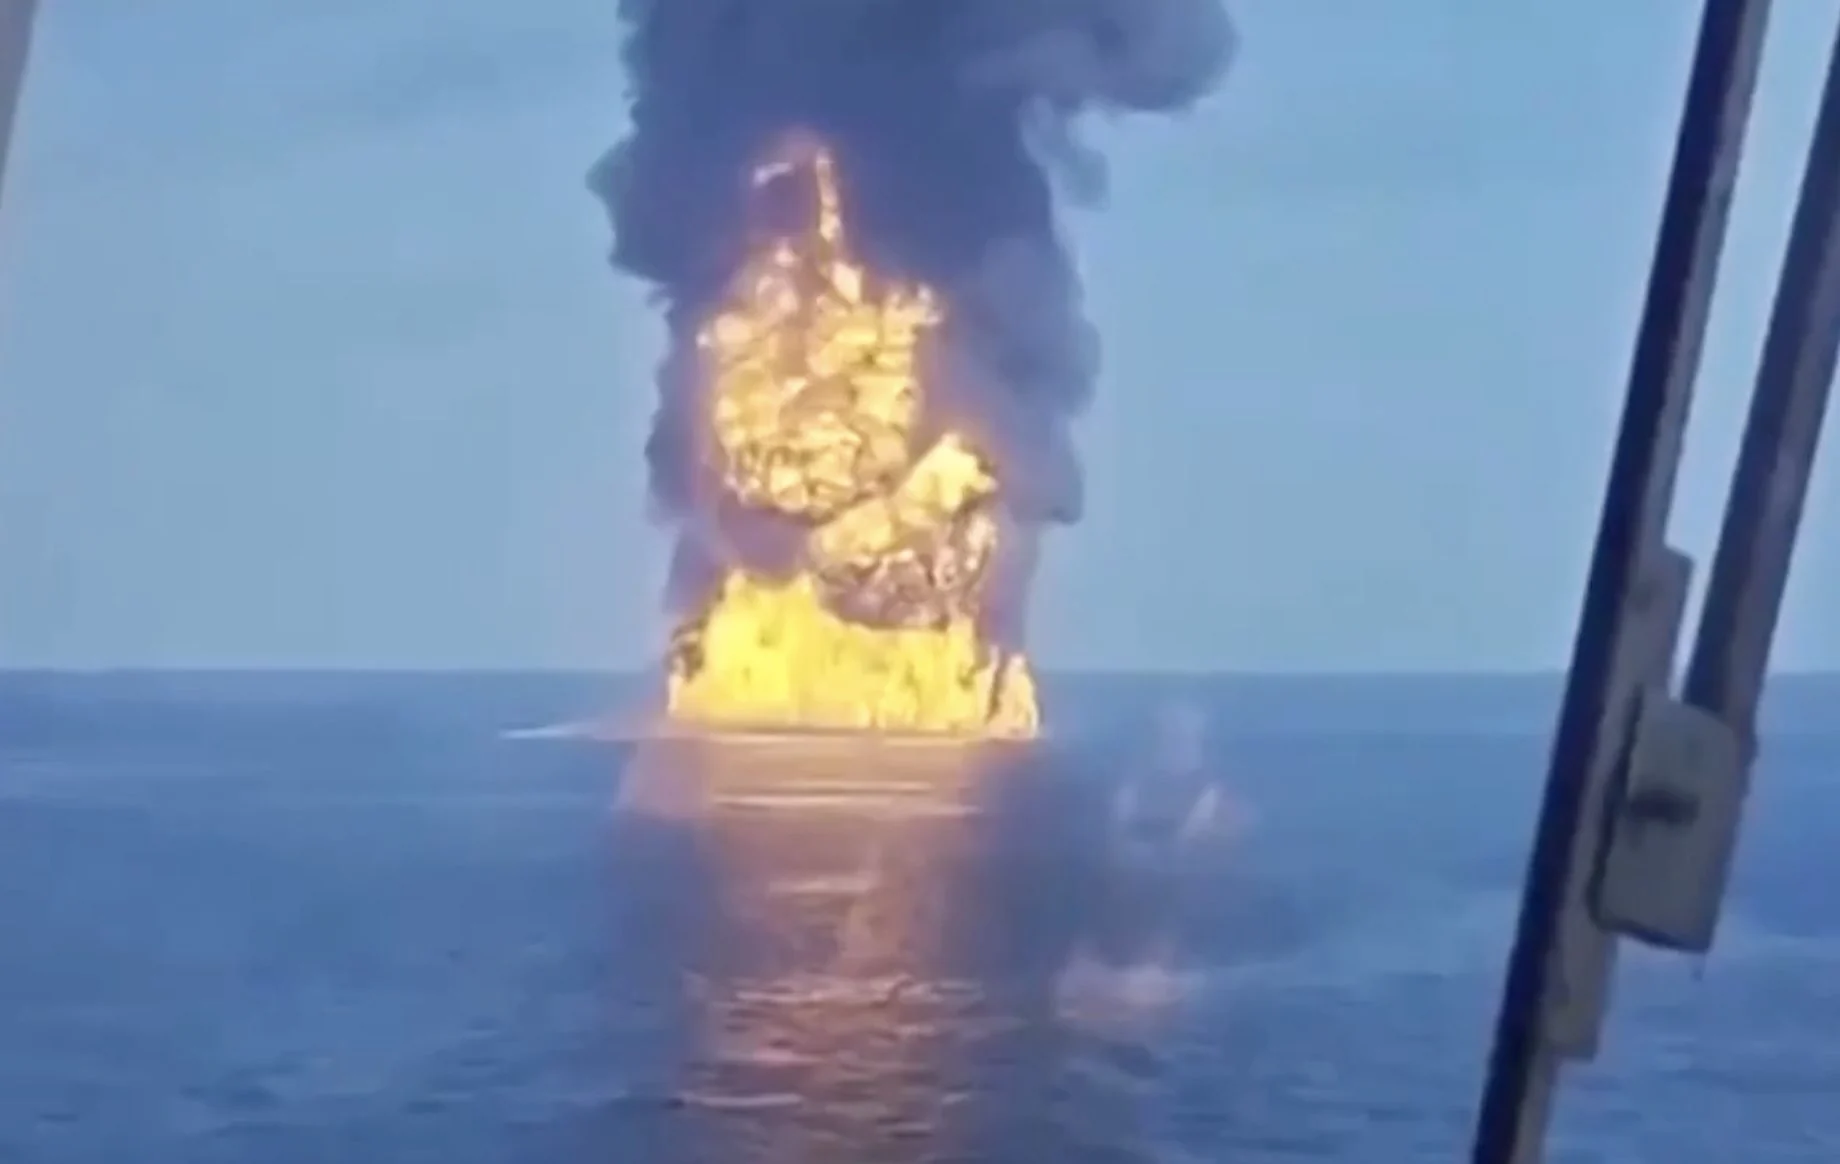
Photo: Across drilling and completions, Patterson-UTI connects data, equipment, and operations through a unified digital platform. Real-time visibility, analytics, and operational expertise support faster decisions, reduce downtime, and continuously improve performance across every operation. Source: https://patenergy.com/
DeepSeek research response:
Research Rundown: Will Brent Crude Fall Below $50/bbl at Any Point in 2026?
Today: Nov 10, 2026. Critically, ~86% of 2026 has already elapsed, and the question is a “at any point” (touch) contract — so the relevant facts are (a) whether it already happened, (b) what the 2026 low actually was, and (c) the odds of a ~45% collapse in the ~7 remaining weeks.
10 Citations
“Brent oil – Price – Chart – Historical Data – News” — Trading Economics (resolution source), updated Nov 10, 2026
https://tradingeconomics.com/commodity/brent-crude-oil
The resolution source shows Brent at $90.10/bbl on Nov 10, 2026, down 2.67% on the day and down 15.52% over the past month, but still +38.27% year-over-year. TE’s models project $100.92 by end-Q4 2026 and $116.84 in 12 months, i.e. the resolution source’s own house view is for prices to rise, not fall. The page records an all-time high of $147.50 (July 2008) and all-time low of $2.23, and notes November’s slide is driven by hopes of a US–Iran diplomatic resolution plus recovering Hormuz traffic.
“Brent Crude Oil Price History by Year — Average & Range” — World Oil Monitor, Oct 6, 2026
https://worldoilmonitor.com/brent-price-history
This dataset (daily front-month futures closes) reports 2026 YTD average $89.40, high $118.35, low $59.96, computed through Oct 6, 2026. The 2026 low of $59.96 is the single most important number for this question: Brent has not come within $10 of the $50 threshold at any point this year. It also reports 2025’s average of $68.10, showing the war-driven ~40% repricing in 2026.
“Brent Crude Oil in 2026: Full Year Analysis” — Convextrade, data through October 2026
https://convextrade.com/metrics/dcoilbrenteu/history/2026
Reports Brent opened 2026 at $61.98, with a 2026 low of $61.08 on January 7 and a high of $138.21 on April 7 (a separate futures-series high). Its monthly table quantifies 2026’s volatility and seasonality: June −28.3% (the largest monthly decline), May −21.5%, then September +20.7% as the war re-escalated. This gives the best guide to how fast Brent can fall in a two-month window — roughly 28% in the worst 2026 month.
“Global Brent Crude Oil Price — 1 year” — Thi Truong Hang Hoa, updated Oct 11, 2026
https://www.thitruonghanghoa.com/en/commodity-prices/brent-crude-oil?period=1¬ation=1
States the 1-year range as $58.92 (Dec 16, 2025) to $118.03 (Apr 29, 2026), confirming that the lowest print of the past twelve months occurred in December 2025 — before the forecast window — at $58.92. Its monthly averages (Jan $60.84, Feb $69.32, Mar $72.87, Apr $103.97, May $110.40, Jun $91.12, Jul $73.45, Aug $90.24, Sep $90.99, Oct $97.96) show no month even close to $50.
“Oil Price Forecast 2026–2027 — EIA Projections” + EIA STEO coverage — World Oil Monitor (Oct 27, 2026) and guandian/Thitruongtaichinhtiente on the Oct 6, 2026 STEO
https://worldoilmonitor.com/oil-price-forecast | https://www.guandian.hk/article/20261007/10019674.html
The EIA’s Oct 6, 2026 STEO raised its outlook: Brent averaging $96.32 in 2026 (from $91.01) and $83.74 in 2027 (from $73.74), with Q4 2026 at $104.69–105 and Q4 2027 at $74. The scenario assumes 4.5 mb/d of Gulf production stays offline at year-end, returning only by mid-2027. Even the official forecaster’s most distant quarterly point (Q4 2027, $74) is 48% above the $50 threshold.
“Goldman Sachs hikes oil forecasts on ‘substantial’ supply risks” — Bloomberg via BusinessWorld / BusinessLine / Investing.com, Nov 1–2, 2026
https://bworldonline.com/bloomberg/2026/11/02/790883/goldman-sachs-hikes-oil-forecasts-on-substantial-risks-to-supply/
Goldman raised its December 2026 Brent forecast to $105 (from $90) and its 2027 average to $88 (from $80), estimating a $27/bbl geopolitical risk premium and a fair value “in the $90s.” Crucially, its explicit bear case is only “into the $60s” (requiring Gulf output 2.5 mb/d above 2025 levels), while the bull case is $140/$130 average. Goldman also cites Polymarket-implied odds that the US–Iran ceasefire ends rising from 10% pre-midterms to ~50% by Nov 15 and ~75% by year-end — i.e. prediction markets lean toward re-escalation, not collapse.
“OPEC+ keeps December targets amid Gulf supply uncertainty” — Petroleum Australia, Nov 2, 2026 (and Edaily, Nov 1, 2026)
https://petroleumaustralia.com.au/news_article/opec-keeps-december-targets-amid-gulf-supply-uncertainty/
OPEC+7 froze December production targets for a third consecutive month (~31 mb/d), with the consequential decision on the 2027 framework deferred to a Nov 29 ministerial. Rystad Energy reports Gulf crude exports at ~12 mb/d vs ~18 mb/d pre-war, base case “fragile pseudo-normalisation” with exports recovering to ~18 mb/d only by July 2027, and VLCC day rates at ~9x pre-war levels. Rystad warns that if Hormuz flows recover materially, OPEC+ “could quickly move from managing constrained supply to managing a sizeable surplus” — the main mechanism by which sub-$60 becomes possible, but on a 2027 timeline.
Bonus (supply-side structure): “OPEC Forecasts Balanced Oil Market by 2026” — Oman News Agency/Reuters, Oct 27, 2026: OPEC now sees a marginal 20 kb/d surplus in 2026 if output holds at October’s 43.02 mb/d, versus the IEA’s earlier ~4 mb/d surplus estimate that drove the January sub-$50 forecasts.
Bonus (market-implied distribution): “PredictMarketCap — Oil Markets” — aggregated Polymarket/Kalshi/Hyperliquid data, accessed Nov 2026
https://predictmarketcap.com/oil
Shows Brent at $88.01 with an implied Dec 31, 2026 distribution: mode ~$65, P10–P90 of ~$57–$180, i.e. the market-implied 10th percentile year-end price is above $57 — the sub-$50 region sits outside the P10 band. (WTI quoted ~$83 with strike ladders concentrated at $66–$95.)
Synthesis: Where Things Stand
Why 2026 inverted the consensus: the January 2026 sell-side consensus (EIA $55, Goldman $56, SBI $50 by June, Enverus $40–50 in H1) was built on a 2.8–4 mb/d surplus. The US/Israel–Iran war from late February removed Gulf barrels (exports fell from ~18 to ~12 mb/d), and Brent averaged $110 in May and peaked at $118–$138 in April.
The arithmetic for a YES resolution is now extreme. From $90.10 (Nov 10), reaching $50 requires −44.5% in 51 days. For scale:
- Largest single month decline in 2026: −28.3% (June)
- Largest 2026 peak-to-trough: ~$118 (late Oct) → ~$70 (late June), roughly −40% over two months
- Even applying that worst-case −40% template to today’s $90 gives ~$54 — still above $50
- Realized 1-month move currently: −15.5%; 12-month change +38%
What would have to happen: a rapid, durable US–Iran settlement restoring Hormuz to pre-war flows (~5–6 mb/d of latent supply) plus the ~$27/bbl risk premium collapsing plus OPEC+ signalling it will defend market share rather than price at the Nov 29, 2026 ministerial — while global inventories remain ~509 mb below end-February levels and the G7’s 100 mb release (announced Oct 2) runs out over four months. Goldman’s own bear case, which assumes Gulf output above 2025 levels, lands in the $60s.
Direction of travel is bearish but insufficient. Brent has fallen ~22% from its Oct 30 high on de-escalation signals (Trump deferring strikes on Iran, Bahri tankers transiting Hormuz, Gulf exports near pre-war). That is a genuine move toward lower prices — but the destination discussed by every authoritative forecaster (EIA $105 Q4, Goldman $105 December, Morgan Stanley/ANZ $105 year-end, 10-institution median $97.50 end-2026) is $95–$105, not $50.
Only real tail-risk path: a repeat of the April→June 2026 collapse (−49% from $138 to $70) triggered by a sudden, comprehensive peace deal. Note that in that episode the physical market was simultaneously at record highs (Dated Brent >$140), so futures fell fast while physical stayed tight — the opposite configuration from today’s $90 futures / ~$105+ dated Brent.
Extracted resolution criteria links:
[‘https://tradingeconomics.com/commodity/brent-crude-oil’]
=== Forecast Result ===
Analysis
Current state (Nov 10, 2026): Brent is trading at ~$90/barrel (TE resolution source), down sharply from recent highs (~$115-120 in October) due to de-escalation in Iran tensions and Hormuz supply recovery. This is a genuine, rapid decline (-15.5% month-over-month, -5.9% in a single session).
Required move: To resolve YES, Brent must fall from ~$90 to below $50 — a ~44.5% decline — within the remaining 51 days of 2026.
Historical context for 2026:
- The 2026 low to date was ~$59-61 (set in January 2026), already ~$10 above the threshold
- The single largest monthly decline observed in 2026 was ~28% (June)
- Even the most severe peak-to-trough move in 2026 (~$138→$70, about -40% over two months during April-June) would not have breached $50 if applied to today’s starting price
Forward-looking signals:
- Multiple institutional forecasts (Goldman, EIA, World Bank, TE’s own model) cluster around $95-$105 for year-end 2026
- Goldman’s explicit bear case lands only in the “$60s,” requiring Gulf supply to exceed even 2025 levels
- OPEC+ has frozen output targets for three consecutive months, with a key decision deferred to Nov 29 — but no scenario discussed anticipates a crash to sub-$50
- Market-implied distributions (per research) show P10 for year-end still above $57
Key assumptions and failure risk:
- No sudden demand shock (recession/pandemic-level event) — probability of such a shock materializing and fully pricing in within 51 days: ~1-2%
- No full resolution of Iran conflict + simultaneous OPEC+ abandonment of production discipline — even if this happened immediately, bear-case models still project $60s, not sub-$50: compounding this with an even larger supply shock is low probability, ~2-3%
- Forecaster consensus poorly calibrated — given convergence across EIA, Goldman, World Bank, and TE models, a joint miss this large is unlikely but not impossible given 2026’s volatility (recall the January 2026 consensus for $50-55 was itself badly wrong in the other direction)
Combining these, a sub-$50 print this year would require an extraordinary, historically unprecedented acceleration of the current selloff — a magnitude of decline about 1.5x larger than any monthly move seen in 2026, compressed into under two months, moving against the explicit consensus of virtually all major forecasters.
Data sufficiency: Sufficient
Probability: 4%
End
About The Author